Success Stories > Construction Labor Productivity, Every Job, Every Week

Construction Labor Productivity, Every Job, Every Week

Every construction job follows a curve. Modern Niagara asked Alphabyte to show, every week, whether hours earned keep pace with hours spent.

Background

Modern Niagara is one of Canada’s largest mechanical contractors, with locations across the country and projects that include some of the most complex healthcare, institutional and commercial buildings in Canada. Major projects run for years, with hundreds to thousands of cost codes and several trades on site at once. On a job of that size the weekly question is always the same: are we earning hours as fast as we are spending them?

Challenge

Modern Niagara’s ERP held the job cost. Payroll held the hours by employee and cost code. The estimate held the planned hours. Percent complete, the number that turns spent hours into earned hours, lived with the project team. Finance could close the month. Project managers and superintendents needed to steer the week.

The result was the gap every contractor recognizes: the data existed, the ERP captured it correctly, and getting it back out at the level a superintendent could act on took days of spreadsheet work. By the time a trend was visible, the hours were already gone.

Fix This for Us!

Modern Niagara asked four questions:

  • Where is each job against its labor budget this week, by trade and by cost code?
  • Which cost codes are burning hours faster than they are earning them, and since when?
  • What will each job cost to finish, and what did that forecast do week over week?
  • How many people, by trade, do we need next quarter and next year across every active job?

Solution

Alphabyte built the reporting in three layers, all inside Modern Niagara’s Microsoft environment.

Percent complete at the source. A web application where superintendents and project managers record percent complete for each cost code every week. The application tracks which cost codes were updated and what share of the job was touched.

One place for the data. An Azure data warehouse that joins weekly hours by employee and cost code from payroll, planned hours from the estimate, revised budgets, the schedule and the percent complete entries on one job ID and one cost code list. Business logic for earned hours, performance factor and forecast at complete is applied once, in one place, and reused by every report.

Reports for each role in Power BI, with row-level security so a superintendent sees the jobs they run:

  • Performance Trending. The labor curve. Weekly manpower against plan as bars, with cumulative hours to date, earned hours, planned hours, revised budget, forecast at complete and forecast to complete as lines. Forecast lines turn dashed from today forward. Filter by job, trade, union class and employee.
  • Performance Trending KPIs. Performance factor, PF in dollars, SPI and CPI week by week, so a drift is visible the week it starts.
  • Job by Trade. Percent complete, performance factor, revised cost, cost to date, earned cost, forecast at complete and the variance to budget, per trade, with the variance flagged.
  • FAC Breakdown. Forecast at complete by cost code, last week’s forecast, the week-over-week change, hours remaining and completed percent, for in-progress and complete cost codes.
  • Forecast Completion Efforts. How many cost codes were updated each week and what share of the job that covered, so managers know how current the forecast is.
  • Planned Resources. Revised planned hours by trade by month and quarter, projected work weeks, and average and peak weekly manpower, for the job and for every active job together.
  • Man Power by Trade. Weekly head count by trade, with hours this week and job to date by employee.
  • Cost Code Schedule. Earliest and latest dates worked and units per cost code, so a cost code that ran long is visible on a timeline.
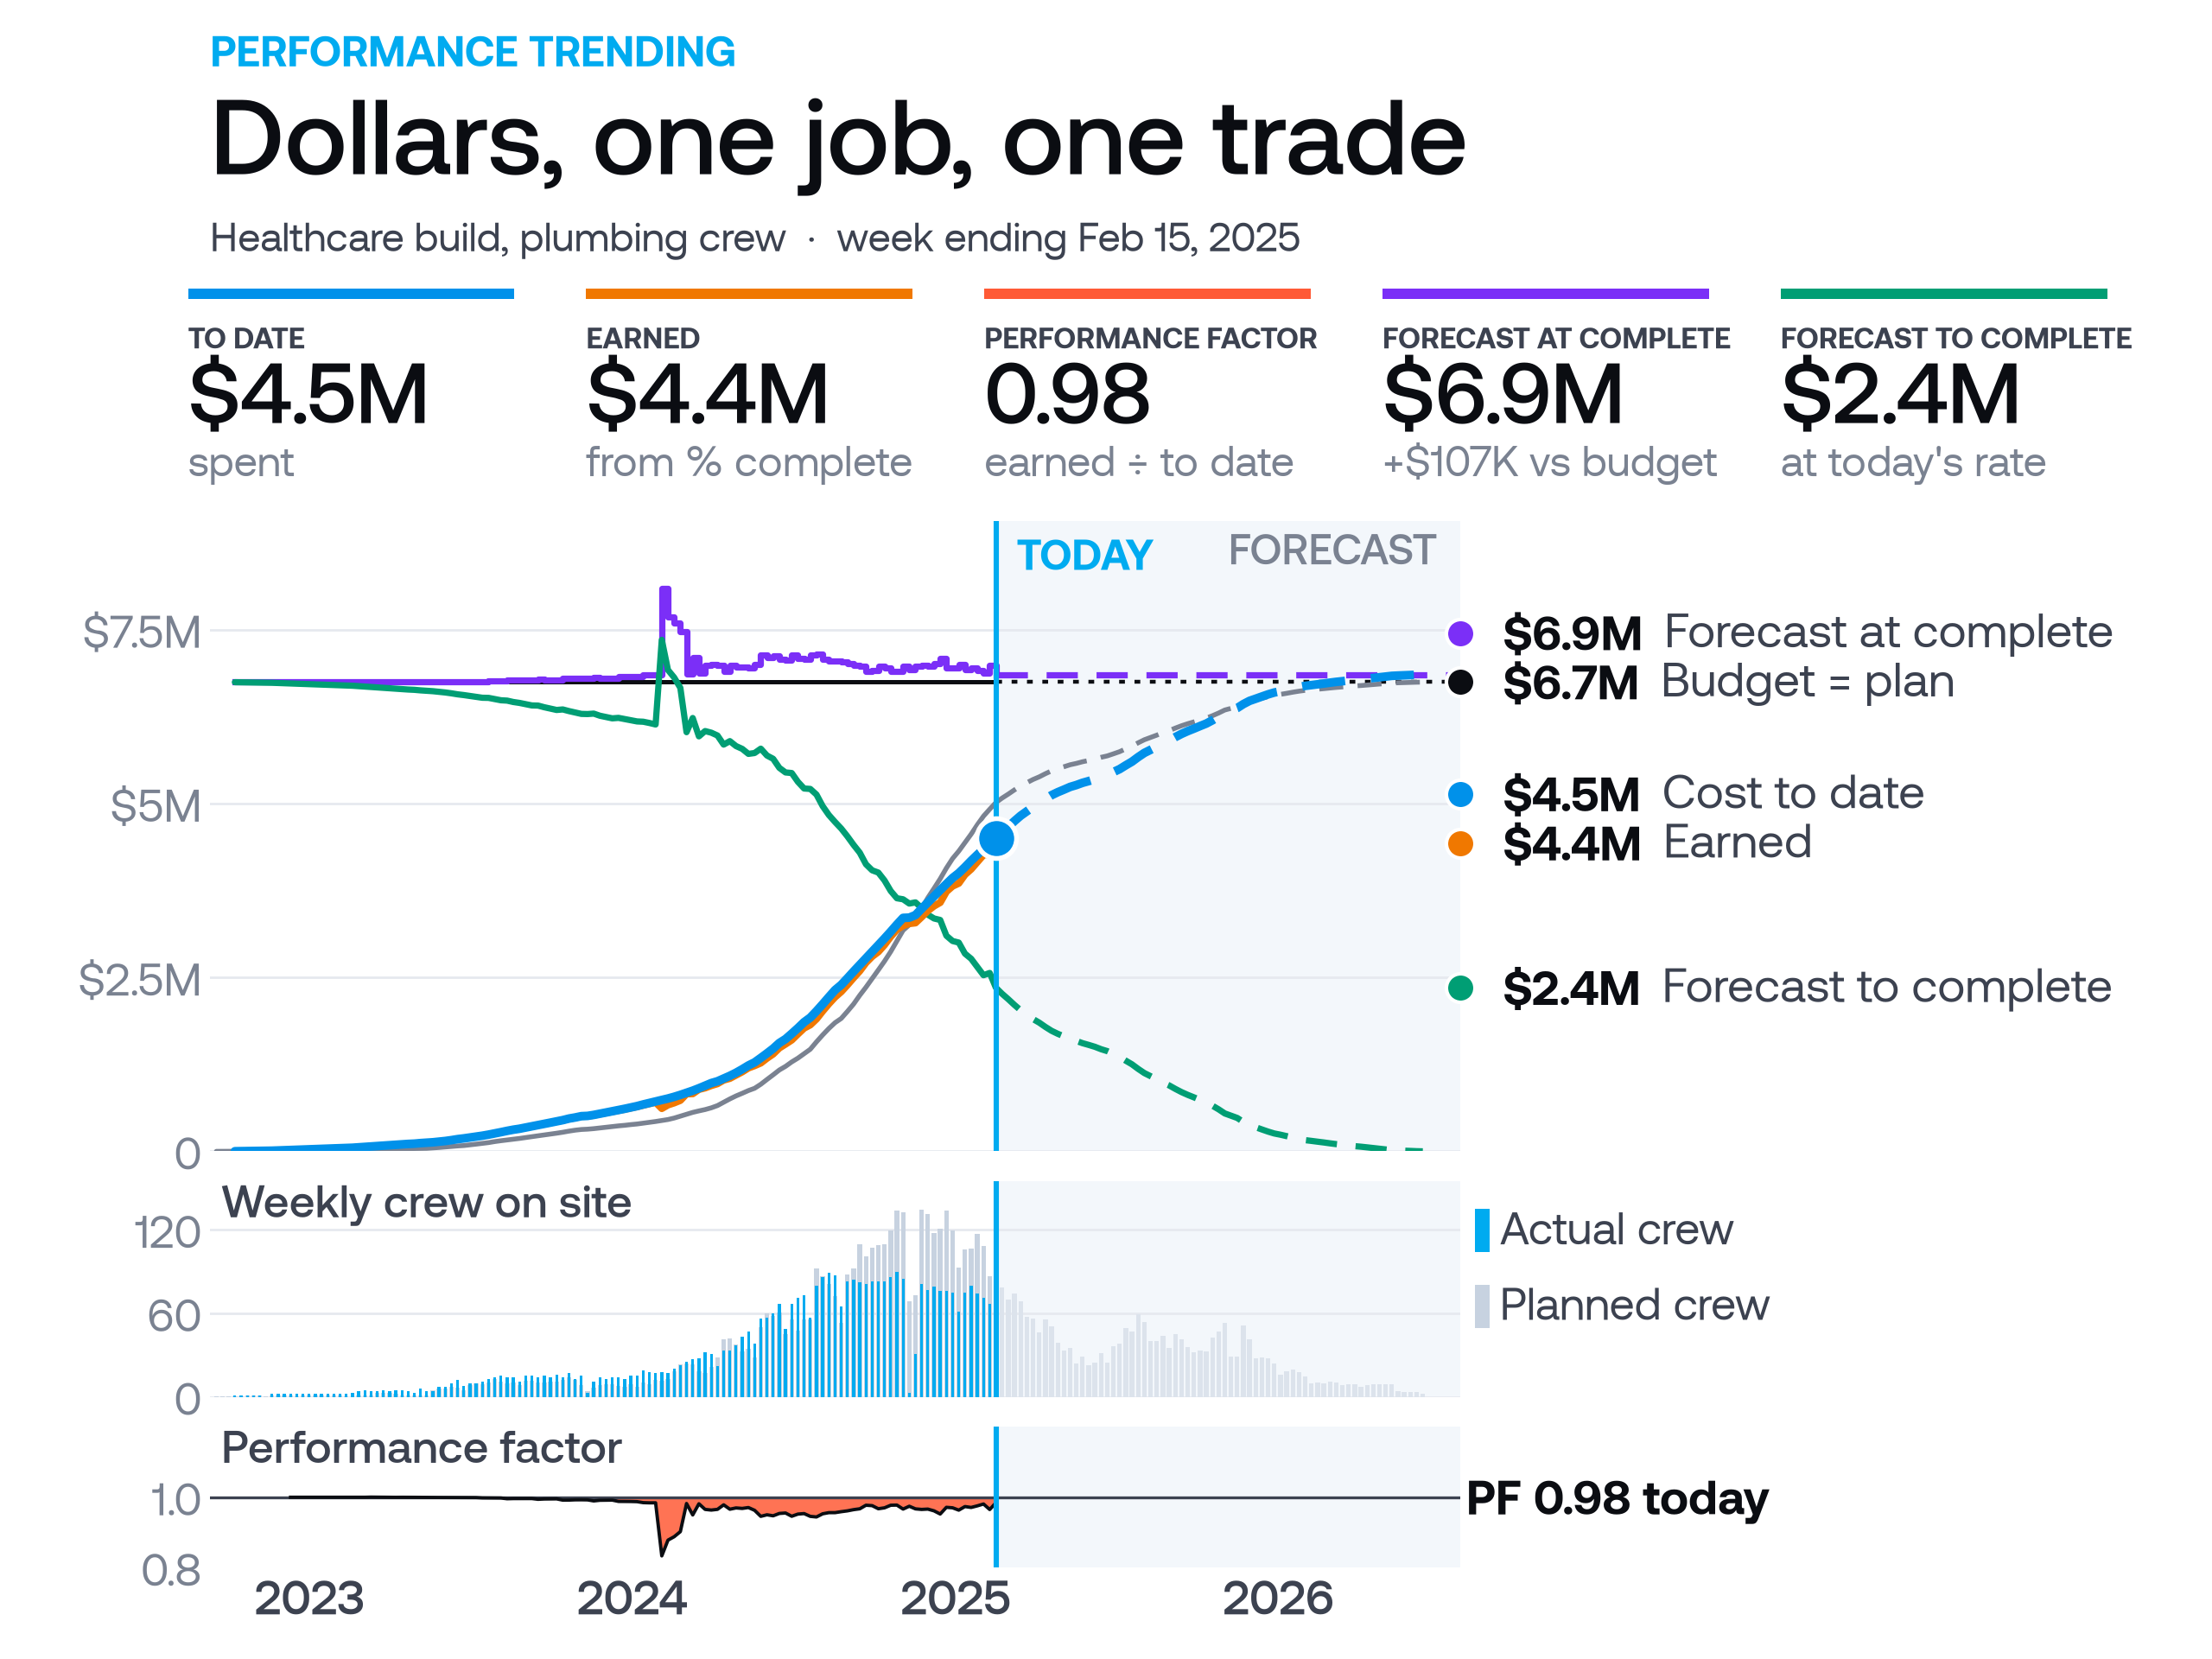
Performance trending for one healthcare job’s plumbing crew in dollars: cost to date and earned against budget, forecast at complete, weekly crew and performance factor

One plumbing crew on a healthcare build at 67 percent spent: performance factor 0.98, forecast at complete $6.9M, visible the week it moves. Illustrative data.

Note the following KPIs in the reports:

  • Earned hours: planned hours for a cost code multiplied by its percent complete.
  • Performance factor (PF): earned hours divided by hours to date. Above 1.0, the job is earning faster than it spends.
  • Forecast at complete (FAC): hours to date plus the hours remaining at the current performance factor.
  • Forecast to complete (FTC): forecast at complete minus hours to date. The number a superintendent can still change.
  • SPI and CPI: schedule and cost performance indices, earned against planned and earned against actual.
  • Peak and average weekly manpower: the crew the plan needs, by trade, for every week ahead.

A Success Story

Superintendents and project managers now update percent complete weekly in a purpose-built application, and the same week see the performance factor and forecast at complete for every cost code they run. Executives see the labor curve across every active job at once, with the budget stepping up as each new job is awarded and the crew curve for the next three years laid out by trade. The data was always there. Now it comes back to the people who can act on it while the job is still live.

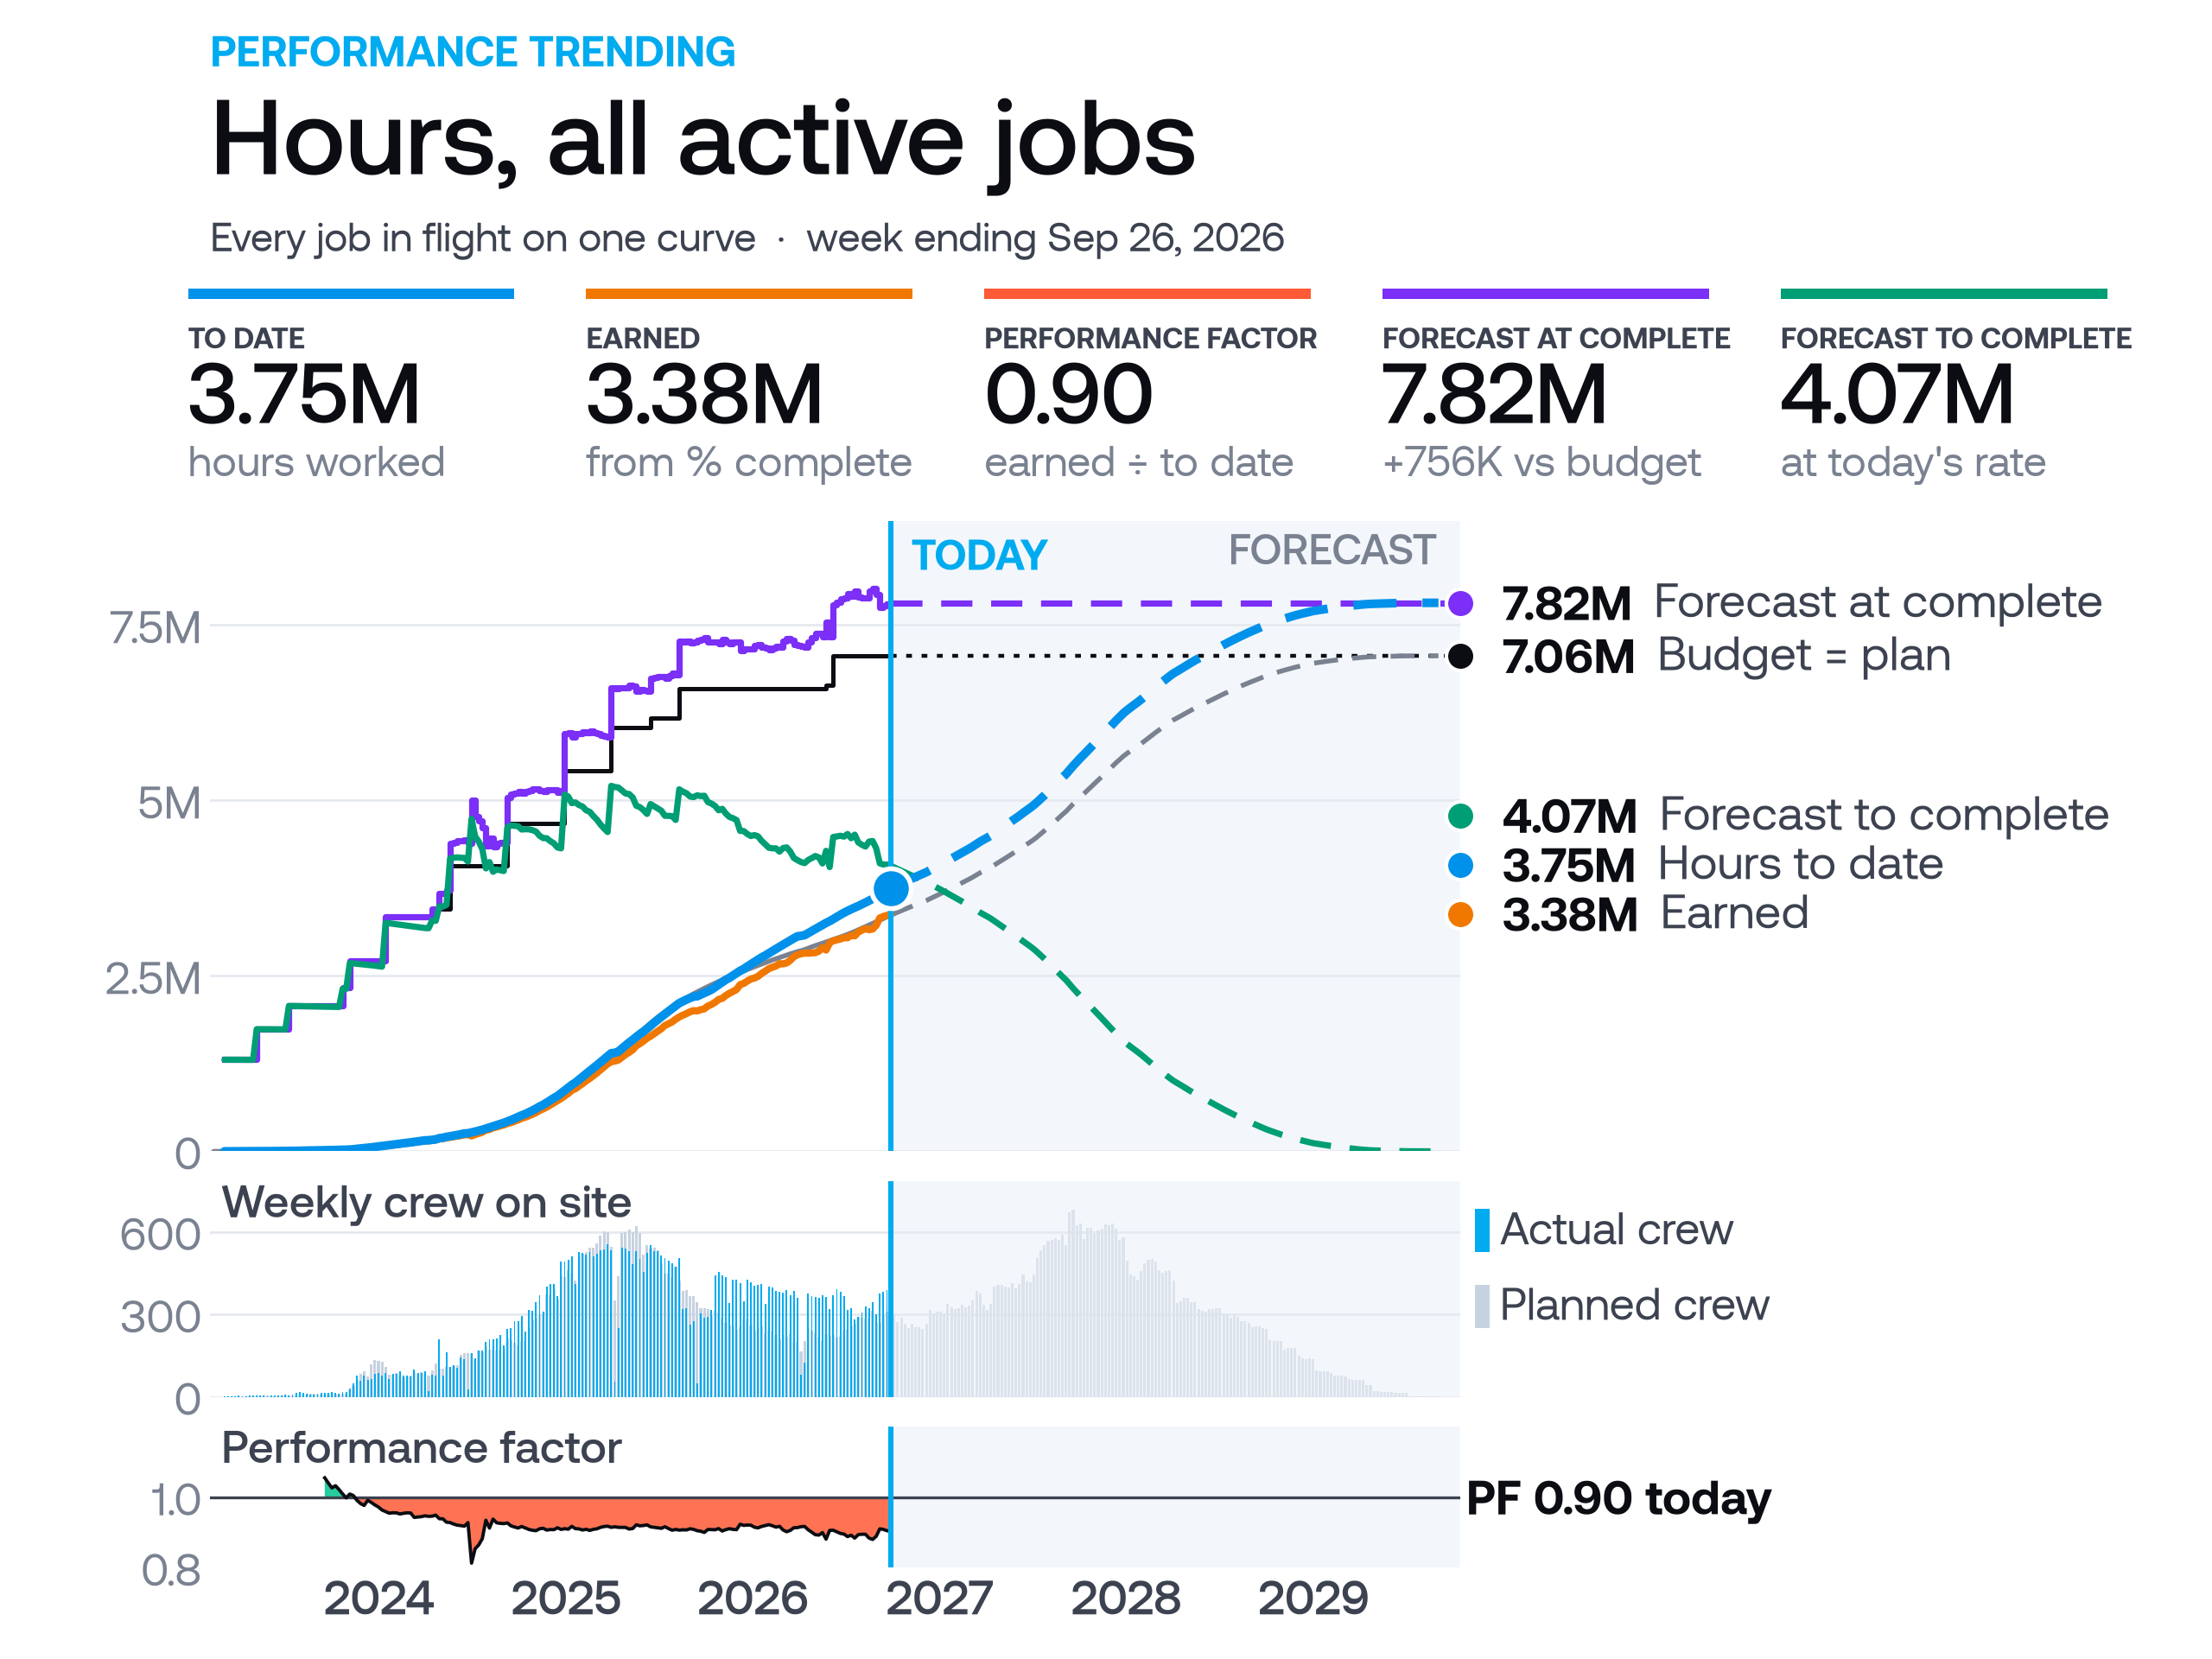
Performance trending for all active jobs in hours: hours to date, earned hours and forecast at complete against budget, weekly crew on site, and performance factor over time

Every active job on one curve: performance factor 0.90, forecast at complete 7.82M hours against a 7.06M-hour budget, and the crew plan three years out. Illustrative data.

More of our work with Modern Niagara: construction analytics and bids management reporting. For the method behind the numbers, read Improving Labor Productivity with Advanced Analytics.

Learn More About Data
& Analytics

    Get In Touch

    Complete this form and someone will connect with you within 1-2 business days.

      Thank you!
      We will be in touch shortly.